
How do you get D&I in your DNA?
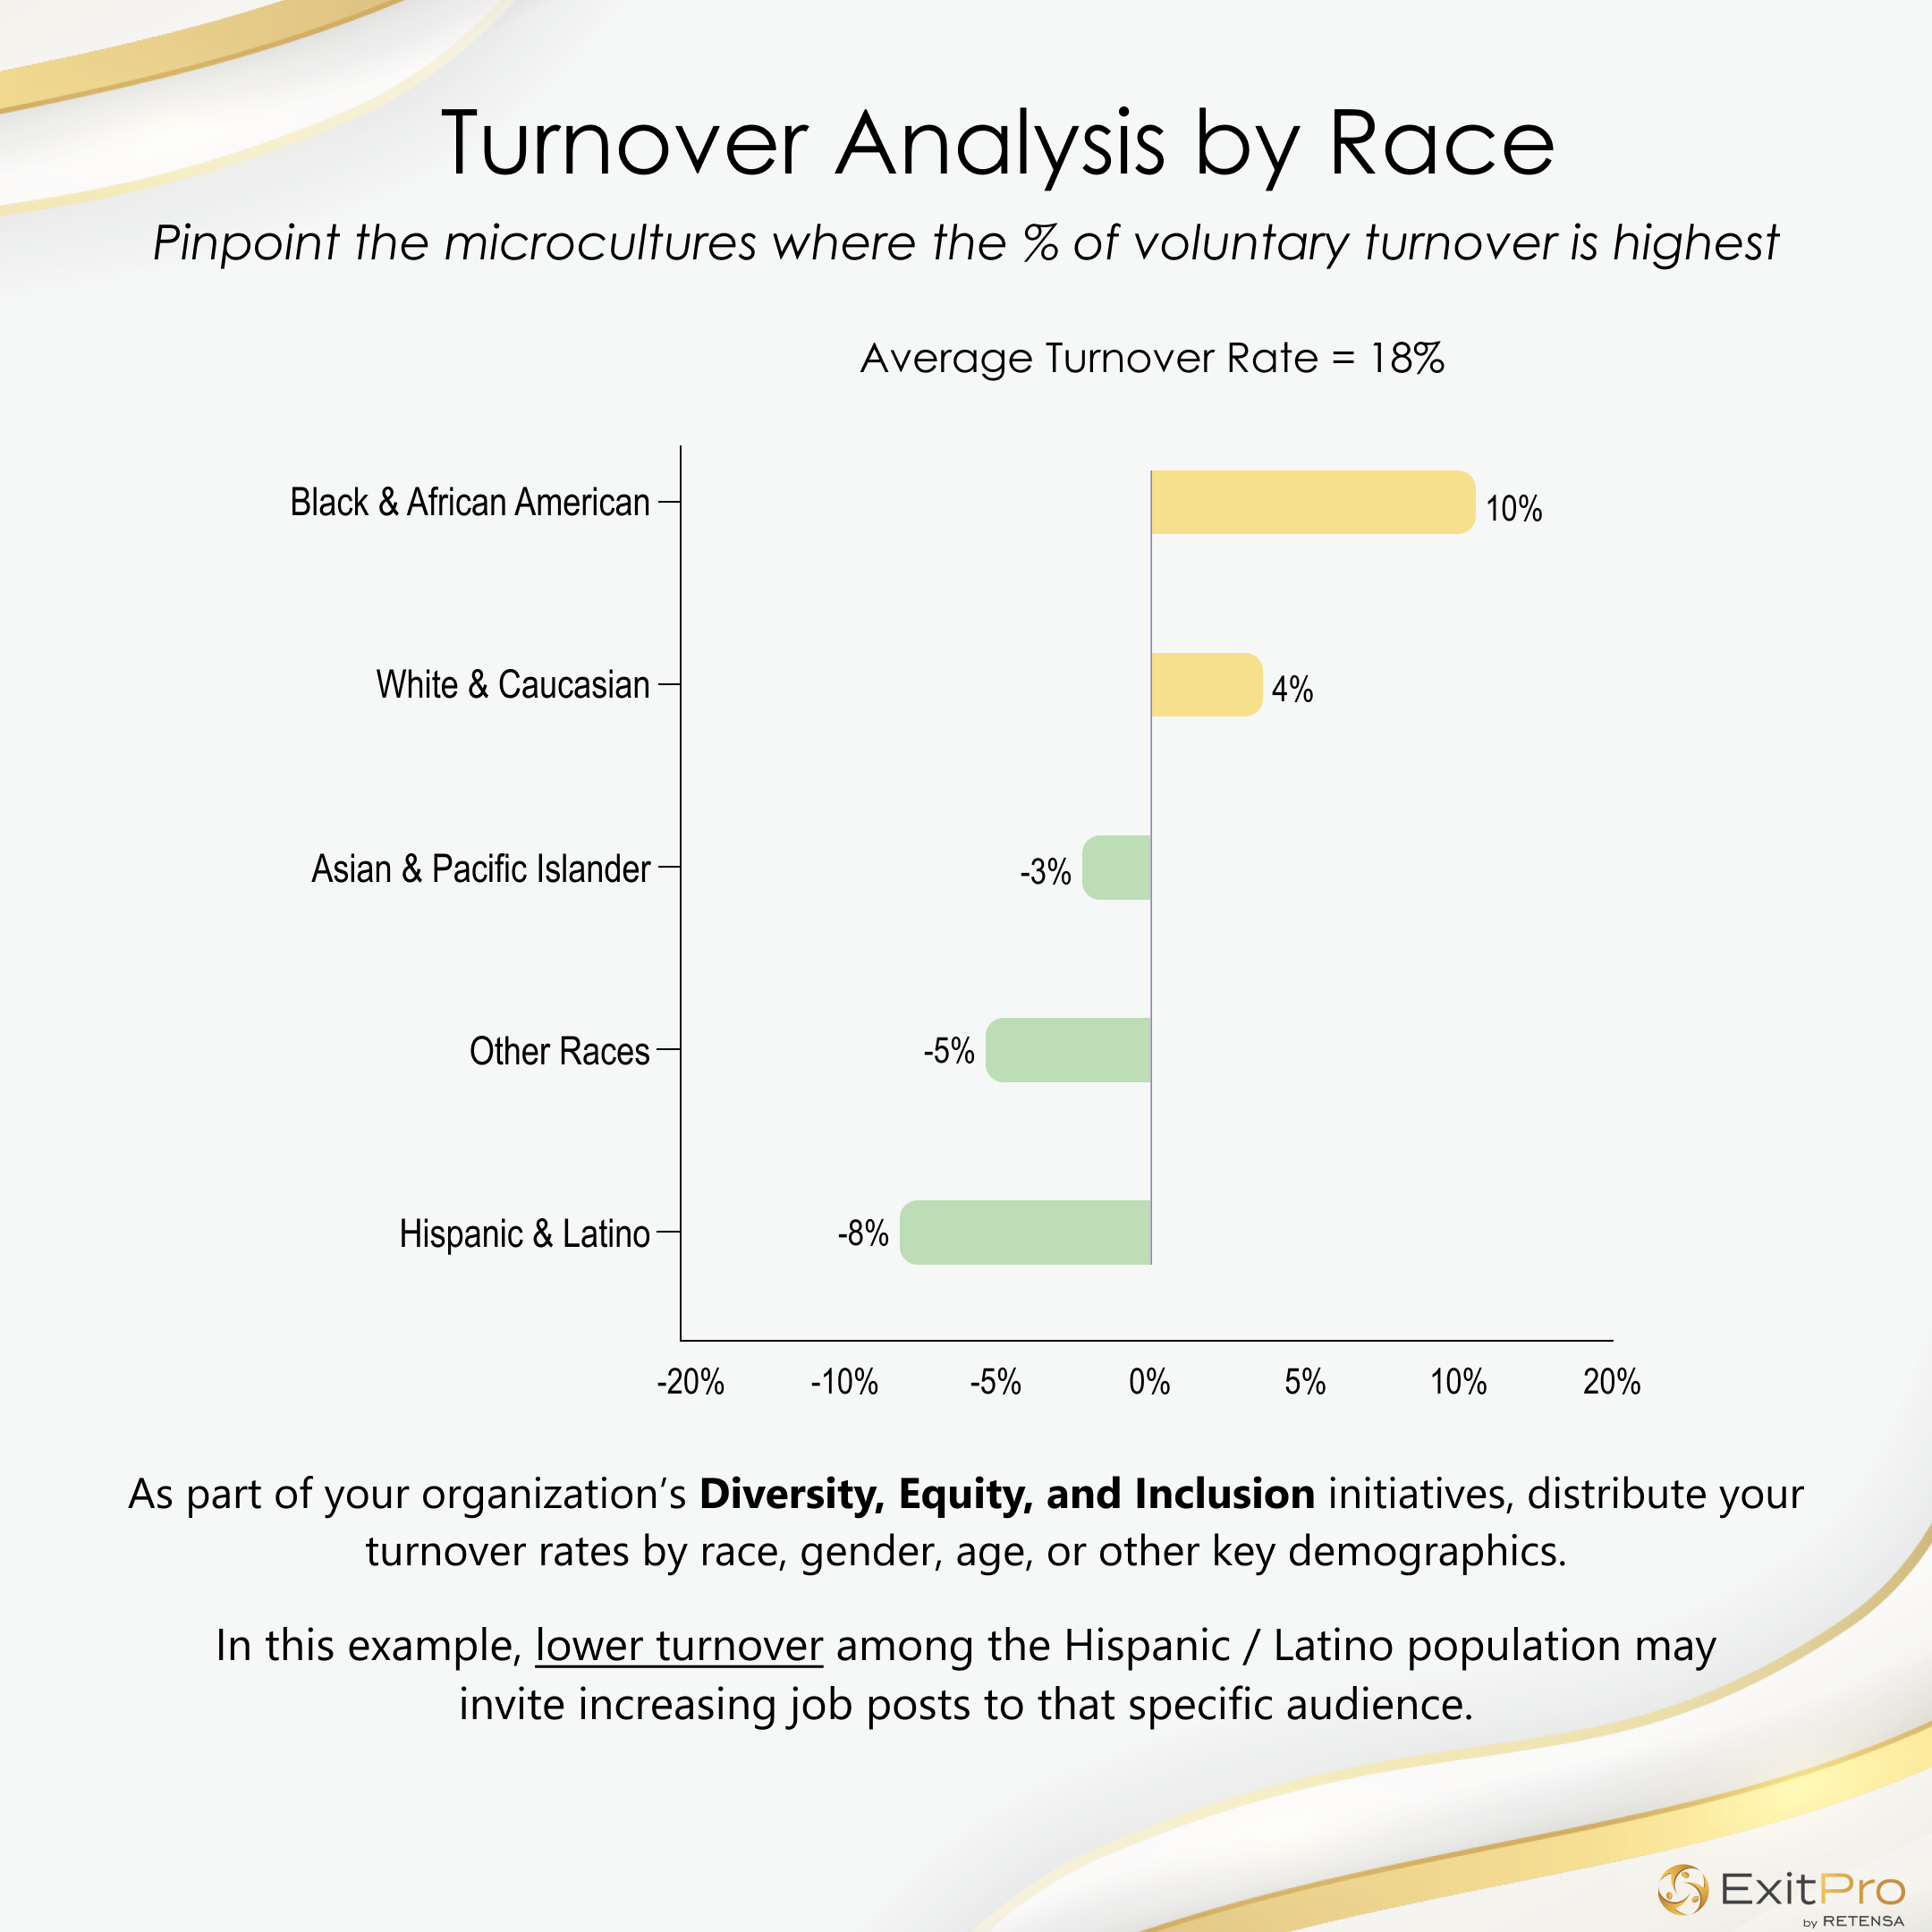
As part of your organization’s Diversity, Equity & Inclusion program, knowing the different turnover rates by race, age, gender is the bare minimum.
Over the past 5 years, employee turnover due to race has cost U.S. organizations $172 billion (SHRM study 2021).
Do you know why women quit?
Do you know when minorities start to look for another job?
With Retensa’s analytics software, pinpoint the WHY and WHEN employee turnover of diverse populations occurs. Visualize your turnover rates by race, gender, age, or other key demographics to pinpoint the microcultures where voluntary turnover is highest. Retain your best employees to reduce turnover and lower costs.
Calculate the cost of turnover at your organization here.
Make informed decisions to retain top talent at www.exitpro.com.
It’s never a good day to lose your best employees.